Trade Analysis of Thursday:
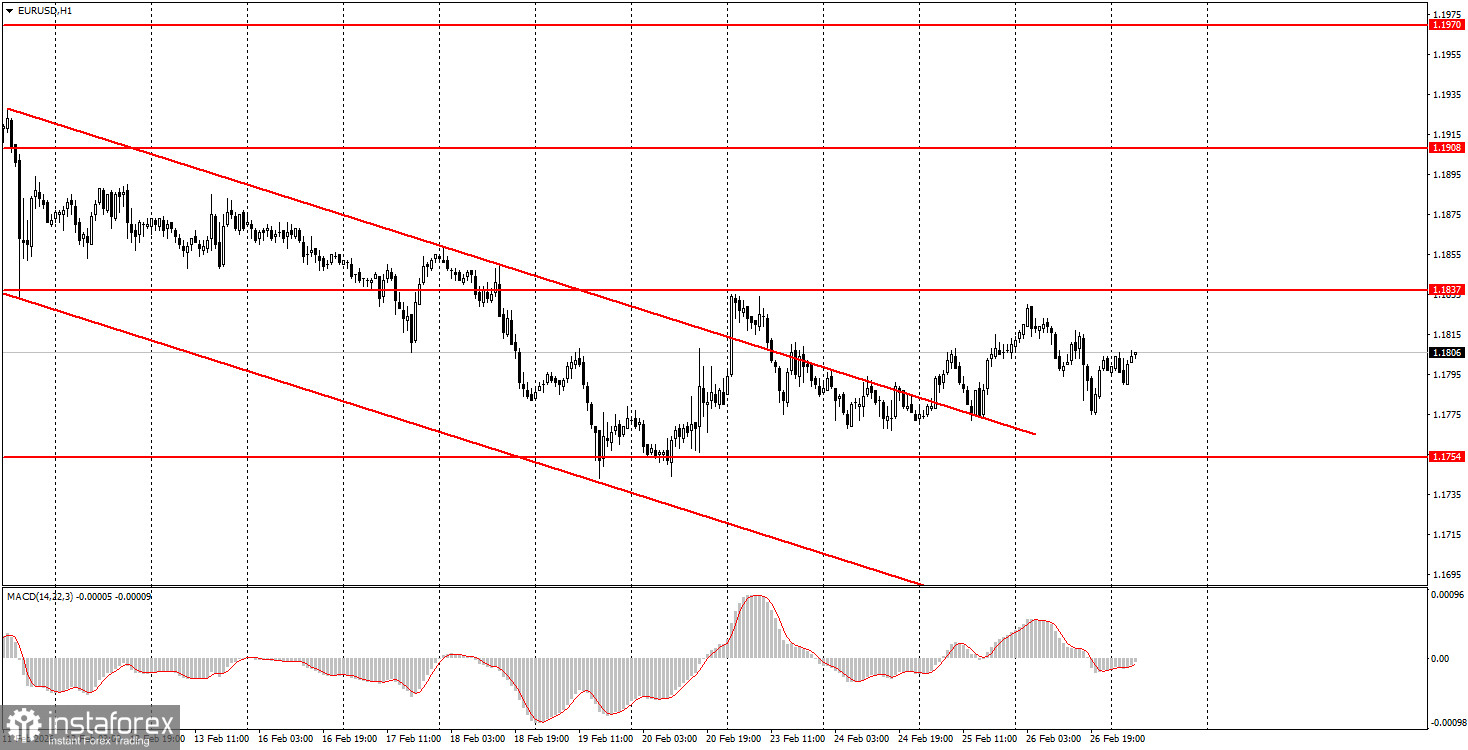
1H Chart of the EUR/USD Pair
The EUR/USD currency pair exhibited unexpected movement on Thursday. The macroeconomic background was absent that day, and the fundamental one as well, but at the same time, the price broke through the descending channel at least twice, allowing the pair to grow. However, as has often been the case lately, the market found another reason to buy dollars. By Thursday evening, it became known that yet another round of negotiations between Iran and the US ended without results. Tehran rejected Washington's nuclear deal, which increased the likelihood of a US military intervention to nearly 100%. Amid rising geopolitical tensions, the dollar appreciated once again. Additionally, yesterday, Pakistan began military actions against Afghanistan, further increasing the demand for safe-haven assets, of which the dollar can still be considered, albeit with significant reservations. As we can see, only geopolitics supports the American currency, although even this factor has its own expiration date.
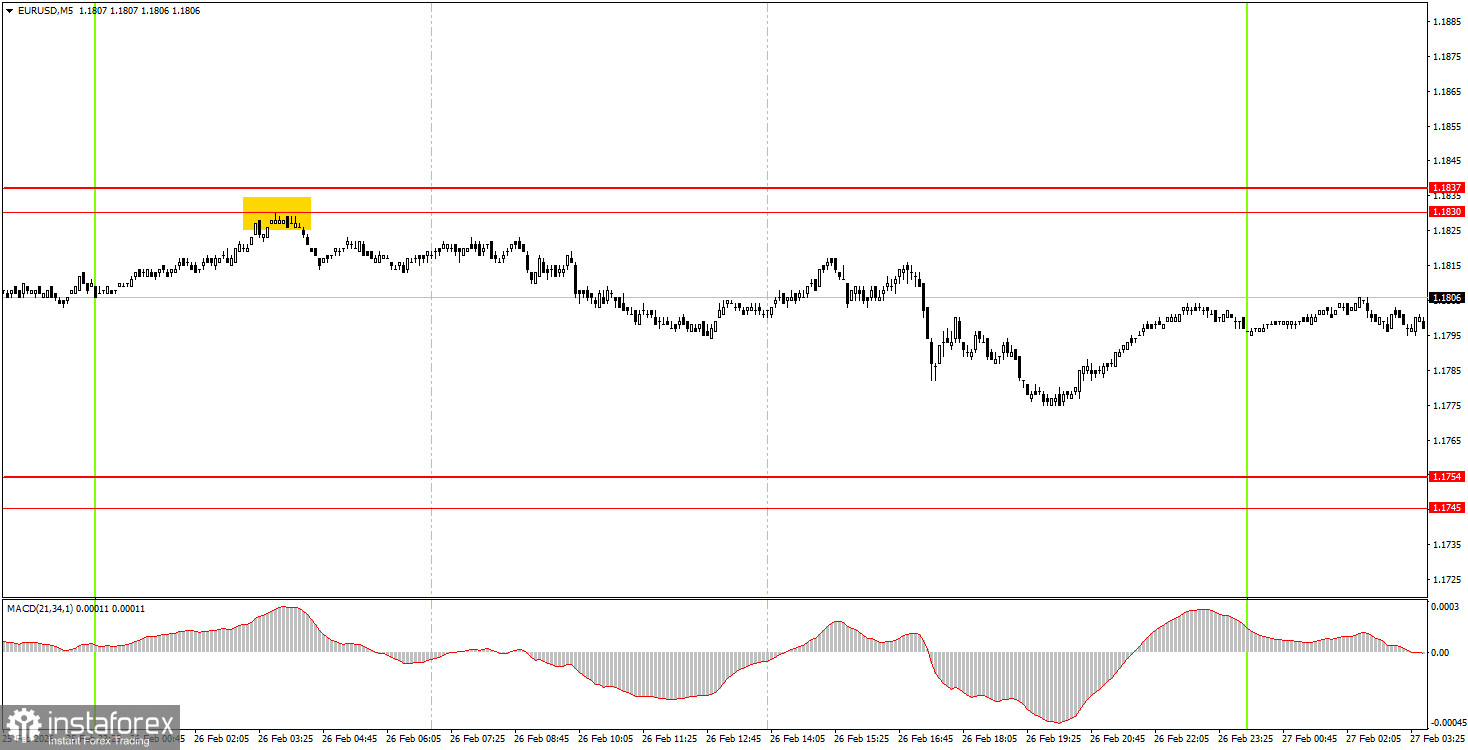
5M Chart of the EUR/USD Pair
On the 5-minute timeframe on Thursday, one trading signal was formed that novice traders could have acted upon. Early in the Asian trading session, the price bounced off the area of 1.1830-1.1837, but at the opening of the European session, the price had hardly moved away from the point where the signal was formed. Thus, a short position could have been opened. The nearest target area, 1.1745-1.1754, was not reached, but traders could close their positions manually in profit by evening.
How to Trade on Friday:
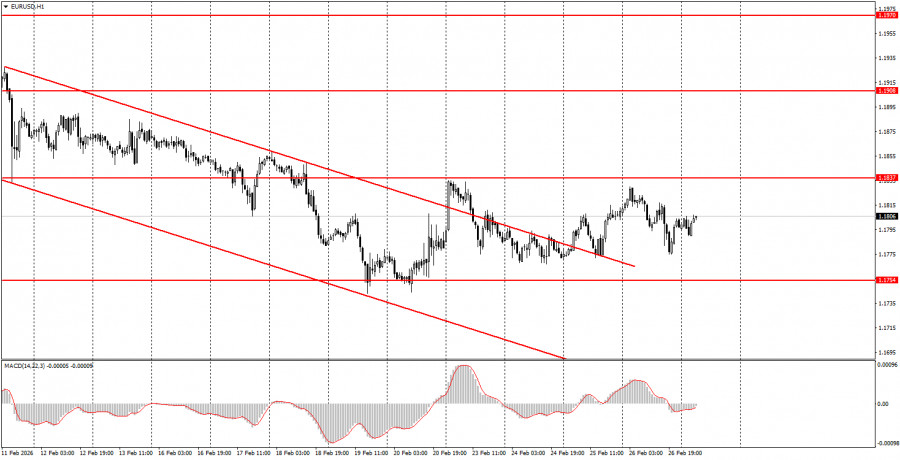
On the hourly timeframe, the downward trend has been canceled as the price has settled above the descending channel. At the beginning of 2026, the long-term upward trend has resumed, so we expect a new medium-term rise of the euro. The overall fundamental background remains very challenging for the US currency, so we fully support further movement to the north.
On Friday, novice traders can consider short positions in the event of a bounce from the 1.1830-1.1837 area, targeting 1.1745-1.1754. A price consolidation above the 1.1830-1.1837 area will allow opening long positions with a target of 1.1899-1.1908.
On the 5-minute timeframe, levels to consider include 1.1455-1.1474, 1.1527-1.1531, 1.1550, 1.1584-1.1591, 1.1655-1.1666, 1.1745-1.1754, 1.1830-1.1837, 1.1899-1.1908, 1.1970-1.1988, 1.2044-1.2056, and 1.2092-1.2104. On Friday, Germany will publish inflation reports, unemployment figures, and jobless claims. In the US, the Producer Price Index will be released. We do not expect a strong market reaction to these reports, as geopolitics currently takes priority for the market.
Main Rules of the Trading System:
- The strength of the signal is determined by the time it takes to form (rebound or breaking through the level). The shorter the time, the stronger the signal.
- If two or more trades were opened around a particular level based on false signals, all subsequent signals from that level should be ignored.
- In a flat market, any pair can generate numerous false signals or no signals at all. In any case, it is best to stop trading at the first signs of a flat.
- Trades are opened during the time period between the start of the European session and until the middle of the American session, after which all trades should be manually closed.
- On the hourly timeframe, signals from the MACD indicator should ideally be traded only when there is good volatility and a trend confirmed by a trend line or channel.
- If two levels are too close to each other (ranging from 5 to 20 pips), they should be considered as a support or resistance area.
- After moving 15 pips in the correct direction, it is advisable to set the Stop Loss to break-even.
What's on the Charts:
- Support and resistance levels are targets for opening buy or sell trades. Take Profit levels can be placed around them.
- Red lines indicate channels or trend lines that reflect the current trend and indicate the preferred direction for trading now.
- The MACD indicator (14,22,3) – the histogram and signal line – serves as a supplementary indicator that can also be used as a source of signals.
- Important speeches and reports (always found in the news calendar) can significantly influence the movement of the currency pair. Therefore, during their release, trading should be conducted with maximum caution, or it is advised to exit the market to avoid a sharp price reversal against the preceding movement.
- Beginners trading in the Forex market should remember that not every trade can be profitable. Developing a clear strategy and practicing sound money management are the keys to long-term trading success.