Friday Trade Analysis:
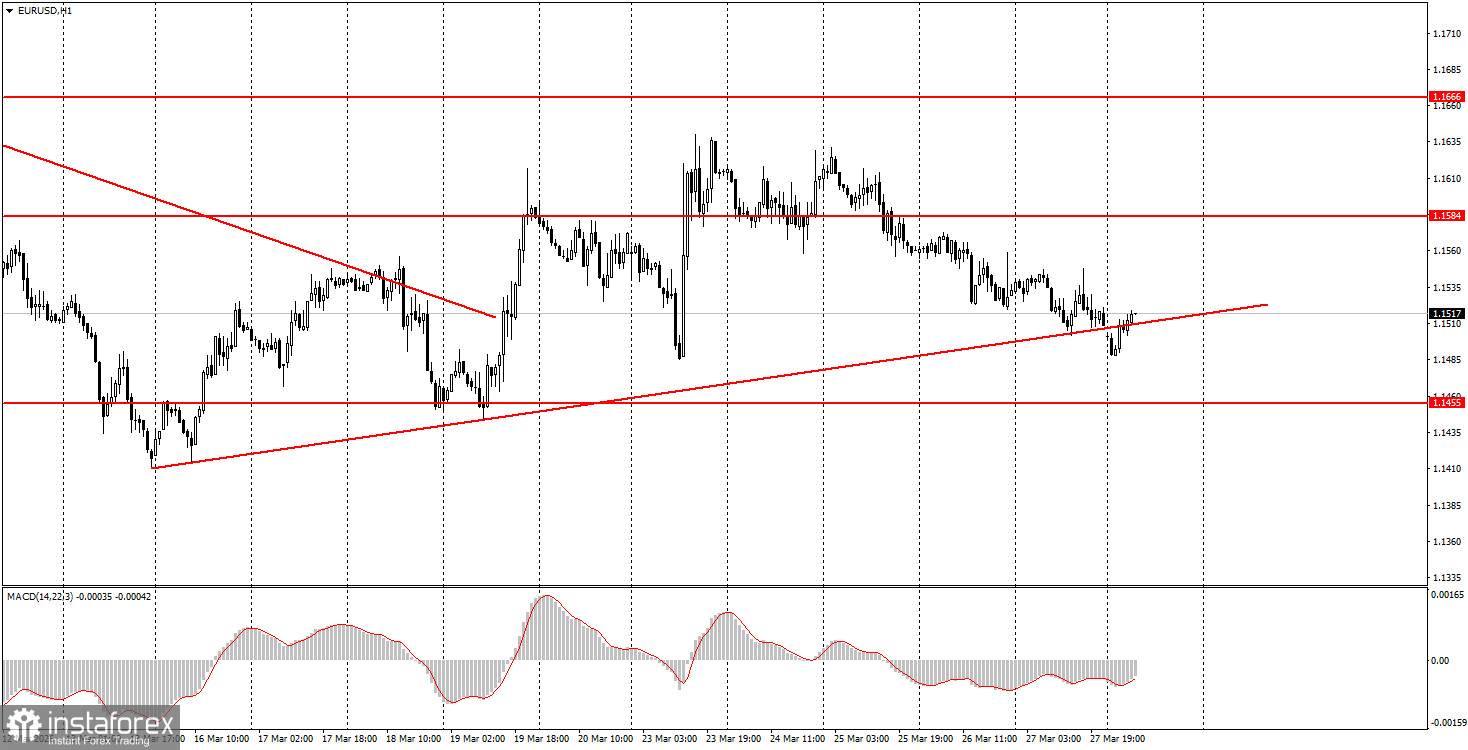
1H Chart of the EUR/USD Pair
The EUR/USD currency pair continued its weak downward movement on Friday. After a surge in the pair's quotes on Monday, when Donald Trump unexpectedly shocked markets with news of successful and productive negotiations with Iran, the euro fell throughout the rest of the week, while the dollar rose. This is not surprising, as Trump's statements were not substantiated over the week. Perhaps the US president is negotiating with someone, but Iran seems unaware of this. Tehran has even openly stated that Trump is negotiating with himself and that all his conciliatory rhetoric is aimed at stabilizing oil, gas, and fuel prices. As we can see, yet again, Trump's brilliant scheme did not succeed. Energy prices continue to rise, American military forces are still being deployed to the Middle East, and currency traders anticipate a new cycle of escalation in the conflict, prompting them to move their capital into the safe dollar.
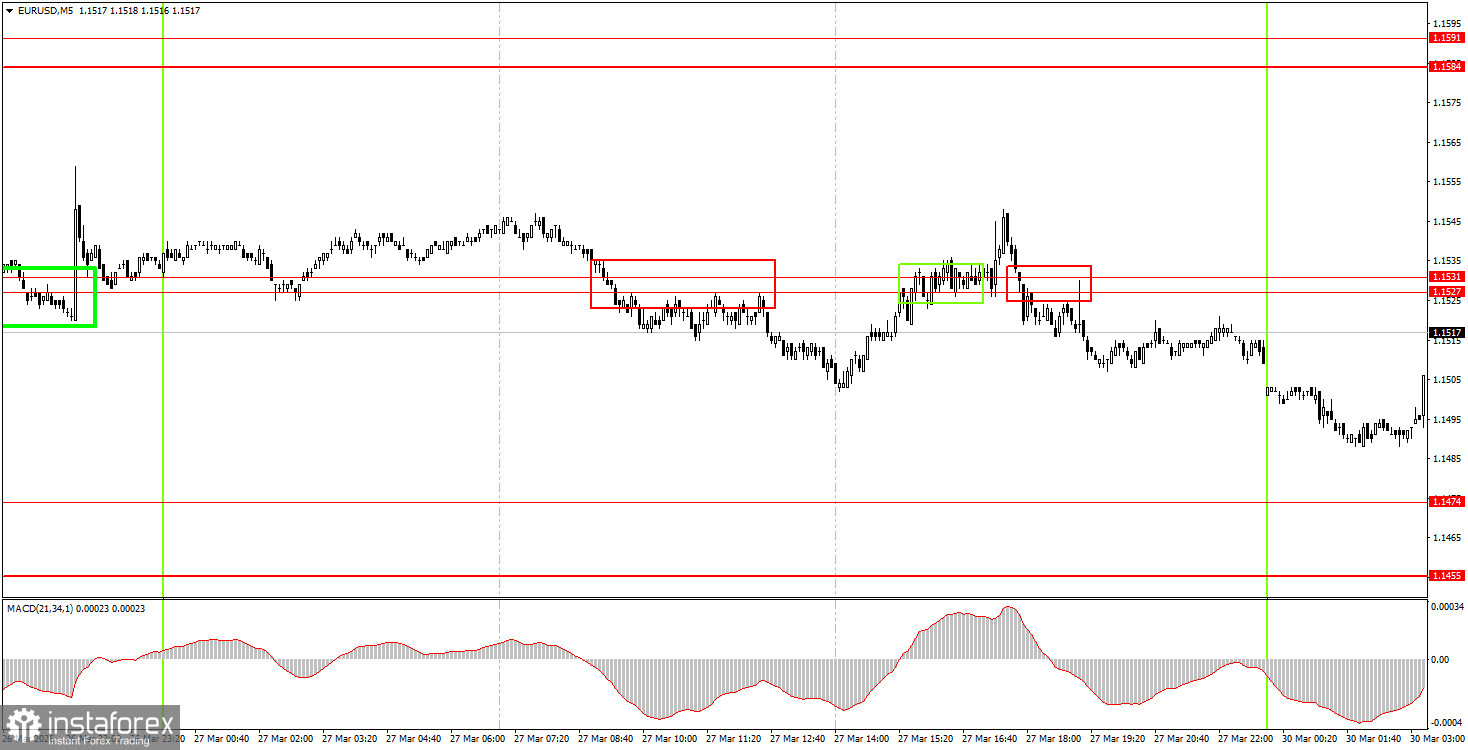
5M Chart of the EUR/USD Pair
On the 5-minute timeframe, three trading signals were formed on Friday, but the nature of the movements left much to be desired, and volatility dropped to minimal levels. The price crossed the 1.1527-1.1531 area three times, but each time it moved only 10-15 pips in the correct direction. Therefore, making a profit on Friday was quite challenging.
How to Trade on Monday:
On the hourly timeframe, the upward correction is continuing, but it could shift into a new round of the 2026 downward trend at any time. A long-term upward trend was restored in early 2026, and we still expect new long-term growth for the euro currency. The overall fundamental background remains very challenging for the US dollar; however, geopolitics is currently the primary focus for the market. This is what prevents the pair from resuming the global upward trend.
On Monday, novice traders may consider short positions if the price bounces from the 1.1527-1.1531 area, targeting 1.1455-1.1474. A consolidation above the 1.1527-1.1531 area will allow for long positions with a target of 1.1584-1.1591.
On the 5-minute timeframe, levels to consider include 1.1267-1.1292, 1.1354-1.1363, 1.1413, 1.1455-1.1474, 1.1527-1.1531, 1.1584-1.1591, 1.1655-1.1666, 1.1745-1.1754, 1.1830-1.1837, and 1.1899-1.1908. On Monday, one of the more or less important events is the German inflation report, expected to jump to 2.6% in March. This information is unlikely to be well received by traders and may not support the European currency; however, rising inflation brings the moment of the ECB's first tightening closer.
Key Principles of the Trading System:
- The strength of a signal is determined by the time it takes to form the signal (bounce or breakout). The less time taken, the stronger the signal.
- If two or more trades have been opened at a particular level based on false signals, all subsequent signals from that level should be ignored.
- In a flat market, any pair can form many false signals or none at all. In any case, at the first signs of a flat trend, it is best to stop trading.
- Trading deals are to be opened during the period between the start of the European session and the mid-American session, after which all trades should be closed manually.
- On the hourly timeframe, it is preferable to trade based on signals from the MACD indicator only when there is good volatility and a trend confirmed by a trend line or trend channel.
- If two levels are positioned too close together (5-20 pips apart), they should be considered a support or resistance area.
- Upon moving 15 pips in the correct direction, a Stop Loss should be set to breakeven.
What to Look for on the Charts:
Price levels of support and resistance are levels that serve as targets when opening buys or sells. Take Profit levels can be placed around them.
Red lines represent channels or trend lines that show the current trend and indicate the direction in which it is preferable to trade now.
The MACD indicator (14,22,3) – the histogram and the signal line – is a supporting indicator that can also be used as a source of signals.
Important speeches and reports (always included in the news calendar) can significantly affect the movement of the currency pair. Therefore, during their release, trading should be done with utmost caution, or traders should exit the market to avoid sharp price reversals against the previous movement.
Beginning traders in the forex market should remember that not every trade can be profitable. Developing a clear strategy and effective money management are the keys to long-term trading success.