Analysis of EUR/USD 5M
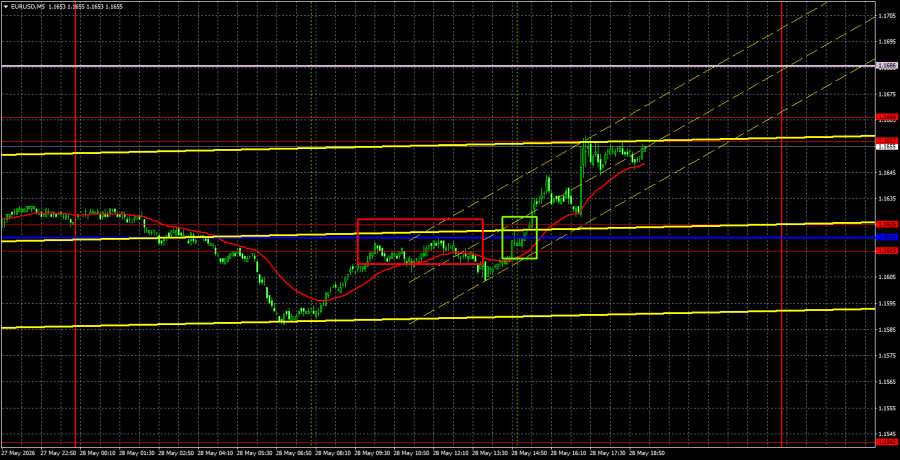
The EUR/USD currency pair began the new week with a fairly strong upward surge, but the market then calmed and remains within a sideways channel bounded by two areas: 1.1615-1.1625 and 1.1657-1.1666. This sideways channel could be extended to 1.1584-1.1615, indicating that the consolidation has lasted for two full weeks. Overall, the flat market is quite logical. There are a few macroeconomic and fundamental events this week, and the geopolitical developments are so numerous (and contradictory) that the market sometimes does not know how to react, leading to very weak movements or no reaction at all. Nonetheless, there are currently no grounds for a strong dollar growth: the ceasefire holds, and the situation in the Middle East has not deteriorated significantly despite two additional ceasefire violations. Conversely, strong growth in the euro hinges on the signing of an agreement and a real de-escalation of the conflict. Thus, the market is simply waiting for a resolution, which should come sooner or later.
From a technical perspective, the downward trend persists. The price remains below the Senkou Span B line, and a trendline cannot yet be constructed. Therefore, we will consider the downward trend complete only after breaking above the Senkou Span B line. Without the signing of a memorandum between Tehran and Washington, it will be difficult for the euro to rise above this line.
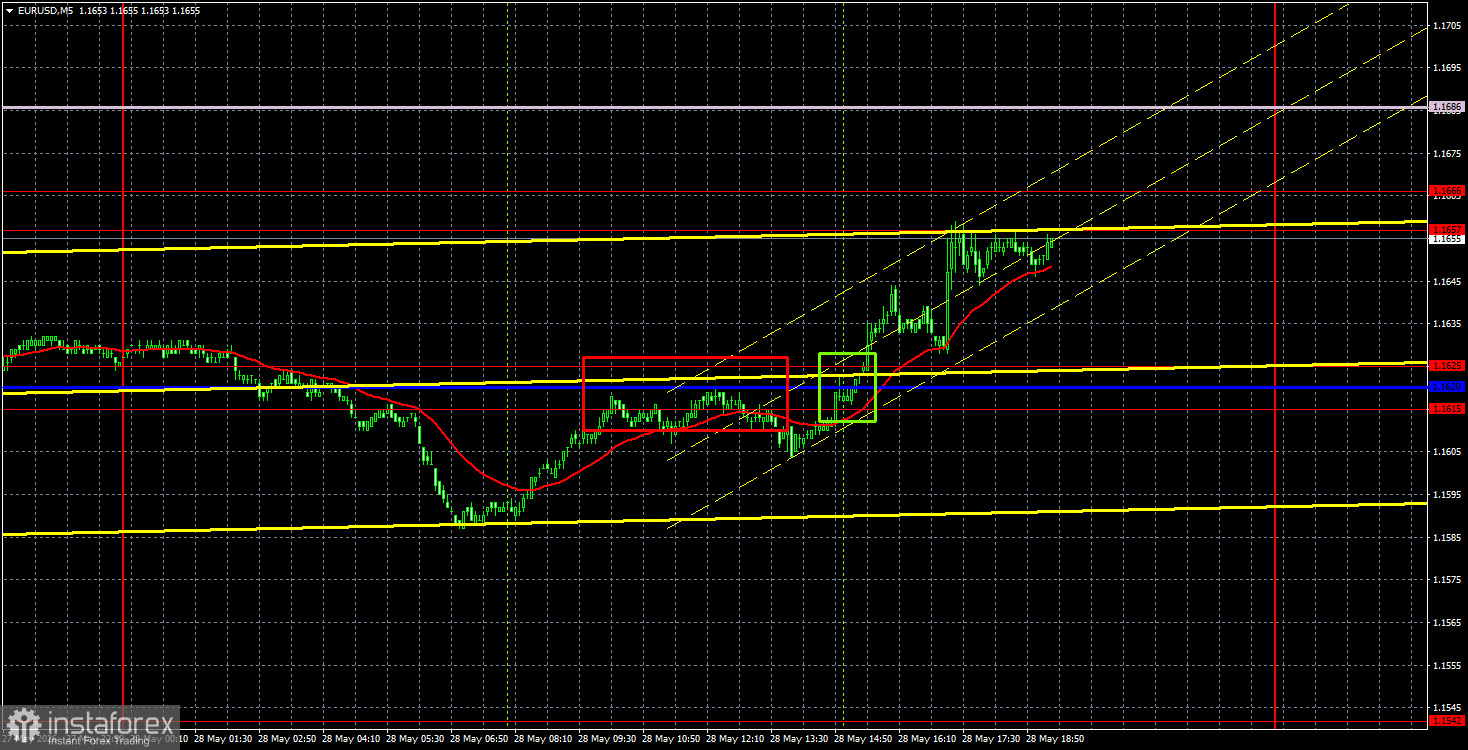
On the 5-minute timeframe, two trading signals were formed on Thursday. First, the pair bounced in the 1.1615-1.1625 area, but this signal proved false, resulting in a loss. The second buy signal in that same area was successful, and the price reached the nearest target area at 1.1657-1.1666 after a few hours, allowing a profit on the trade.
Analysis of EUR/USD 4H
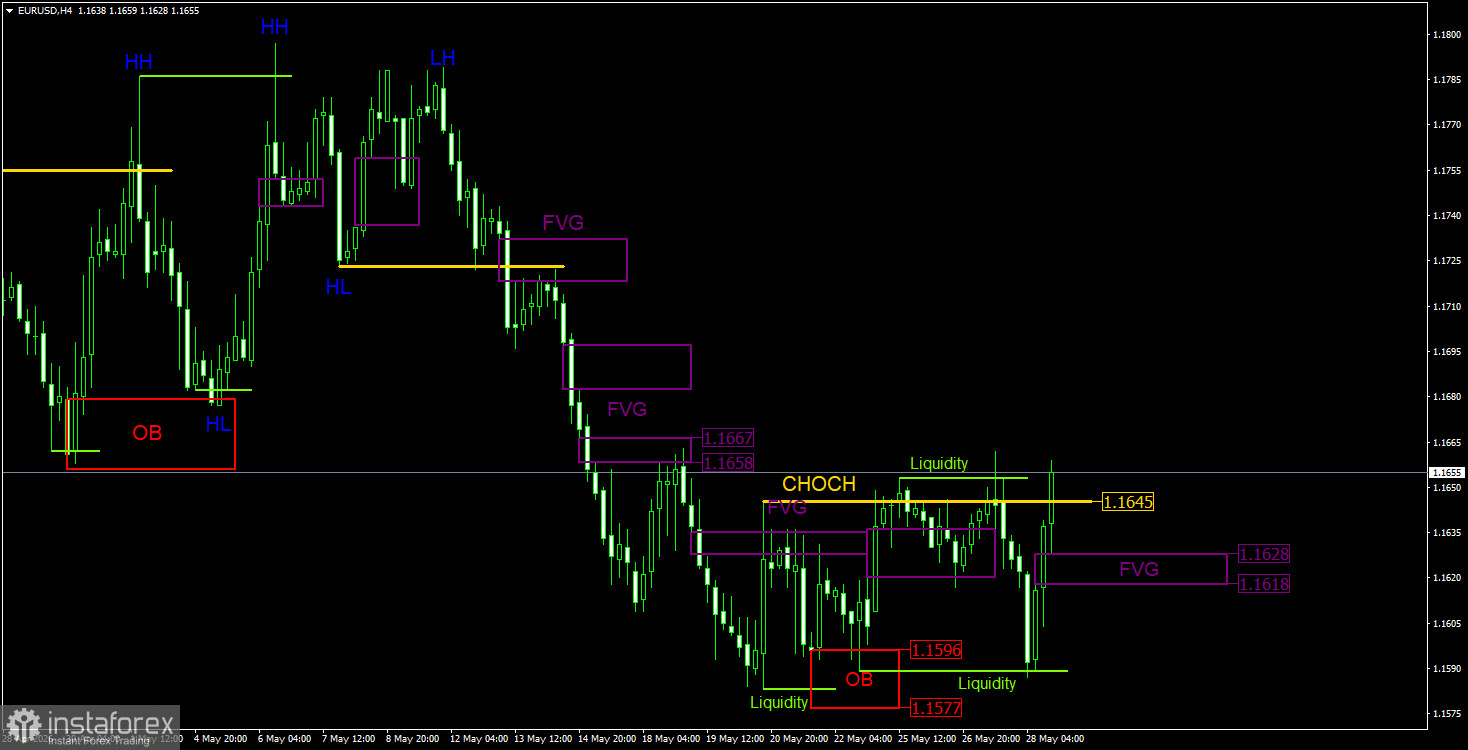
On the 4-hour timeframe using the ICT trading system, the price declined significantly on Thursday without forming sell signals, removing liquidity on the buy side from the last local low and surging upward, simultaneously forming a "bullish" FVG (Fair Value Gap). If the current upward movement does not conclude with the removal of sell-side liquidity from the last local maximum, it may be possible to consider opening long positions on a pullback from this bullish FVG. The CHOCH (Change of Character) line may be breached as early as today.
Analysis of EUR/USD 1H
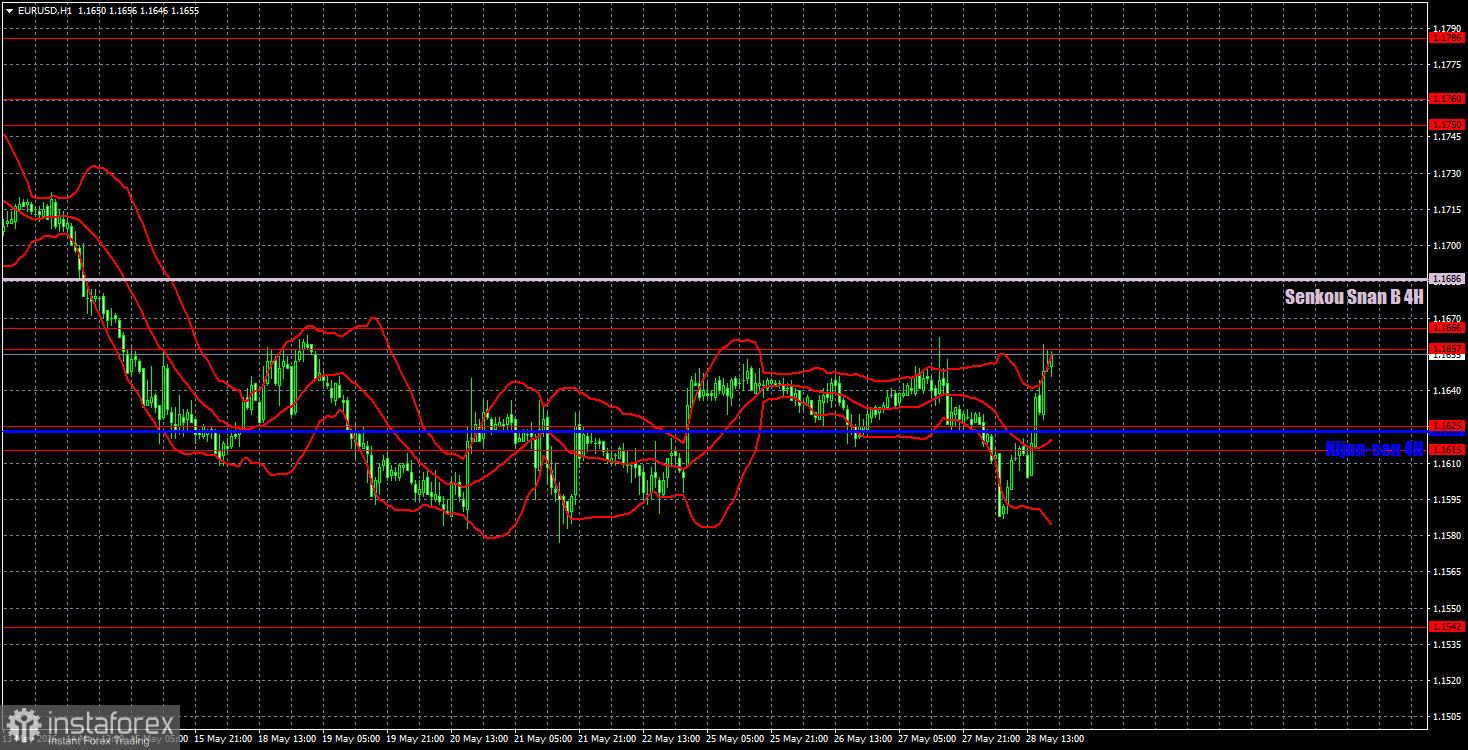
On the hourly timeframe, the EUR/USD pair continues to trade in a downward trend and has been in a flat range for two weeks. The situation in the Middle East remains tense but has not worsened, and Washington and Tehran may only be able to sign a preliminary agreement in theory. If no new signs of escalation arise in the Middle East and the memorandum is indeed signed, the dollar will start to lose its position. But for now, we observe the opposite picture.
For May 29, we highlight the following trading levels: 1.1362, 1.1426, 1.1542, 1.1615-1.1625, 1.1657-1.1666, 1.1750-1.1760, 1.1786, 1.1830-1.1837, 1.1907-1.1922, as well as the Senkou Span B line (1.1686) and the Kijun-sen line (1.1624). The Ichimoku indicator lines may shift during the day, which should be taken into account when determining trading signals. Remember to set Stop Loss orders to break even if the price moves in the right direction by 15 pips. This will protect against potential losses if the signal turns out to be false.
On Friday, Germany will publish unemployment and inflation reports, but under current circumstances, they are secondary. Although the inflation report is important, it could help anticipate overall European inflation and, consequently, the European Central Bank's decision on rates in June.
Trading Recommendations:
Today, traders may open short positions targeting 1.1615-1.1625 and 1.1585 if the price bounces from the 1.1657-1.1666 area. Long positions may be opened on a breakout above the Senkou Span B line, targeting the 1.1750-1.1760 area. On the 4-hour timeframe, longs will be relevant if a signal forms in the last bullish FVG at 1.1618-1.1628.
Explanations for Illustrations:
- Support and resistance price levels are indicated by thick red lines where price movement may end. They are not sources of trading signals.
- The Kijun-sen and Senkou Span B lines are Ichimoku indicator lines that are transferred from the 4-hour timeframe to the hourly timeframe. They are strong lines.
- Extremum levels are thin red lines from which the price has previously bounced. They are sources of trading signals.
- Yellow lines represent trend lines, trend channels, and any other technical patterns.
- CHOCH stands for Change of Character in trend structure.
- Liquidity refers to Stop Loss, pending orders that market makers use to build their positions.
- FVG is a Fair Value Gap. Price moves through such areas very quickly, indicating a complete absence of one side in the market. Subsequently, the price tends to return and react from such areas in continuation of the main trend.
- IFVG is an Inverted Fair Value Gap. After returning to such an area, the price does not react and impulsively breaks through, then tests from the other side.
- OB stands for Order Block. A candle on which the market maker opened a position to take liquidity to form their own position in the opposite direction.